I’m going to list them in the order visited…
1. United States. 1972. I was born here!
2. Canada. 1983. We went to Niagara Falls, and during the trip, the Army Corps of Engineers blew off Terrapin Point. Here’s a cool tidbit: we had a home movie camera with us and the parents set it up on the hotel balcony and filmed the explosion. I couldn’t find any video on YouTube. I should probably see if the parents still have it and try to get it posted. The best way to watch the video? In reverse (which was easy on the old reel to reel spools). Pretty cool to watch a bunch of dust rush to the ground and then have rocks slide up a hill from rubble into a beautiful point.
UPDATE (2018): Dad has a box of our old home movies that I can go through someday to see if I can find this video. But I’ll need to find a projector to view them…
3. United Kingdom. 1988. This was the bell tour summer after sophomore year of high school, I had my first beer in a proper pub in London (shh, don’t tell the chaperones). Fittingly, it was a Faust Lager.
4. Switzerland. 1990. This was the bell tour summer after senior year of high school, 1990. Lots of great memories from that trip including a hike to the first base camp on the Matterhorn (from Zermatt) where Steve and I hammed it up in a great photo that I think Kevin Geiger snapped…
5. Germany. 1990. Bell tour.
6. Austria. 1990. Bell tour.
7. Costa Rica. 2000. Honeymoon! Leena takes me traveling internationally for the first time.
8. India. 2004. We covered a lot of ground over three weeks: Delhi, Agra (Taj Mahal), Bombay, Ahmedabad, Modasa, Udaipur, Goa, and Kerala.
9. Netherlands. 2004. This was the first of several business trips to Nike’s European Headquarters in Hilversum.
10. Spain. 2006. We made a quick overnight trip to Madrid from Nike’s EHQ to visit retailers in Madrid. In 2018, we spent time in Spain in October and November on either side of going to Morocco for the first time.
11. Belgium. 2007. A day trip from Nike’s EHQ to Antwerp to visit retailers.
12. Thailand. 2007. I was invited to give a session at Nike’s Asia Pacific sales conference covering features of our newly upgraded portal on nike.net. Leena came over at the end of the week and we added a week’s vacation in Bangkok and Phuket.
13. Australia. 2008. This was our first trip on miles, and the first trip I blogged. I negotiated with work to get three weeks off (normally two is the limit for one stretch) by leaving just before Christmas. I got seats to Sydney (from San Francisco) on the first call (a year in advance) and was told to call back in three weeks for return seats. I did, but no seats were available. I called multiple times each week and soon had the request down pat: any two seats from anywhere in Australia or New Zealand plus or minus a week of our target date, to anywhere in the US. In April, there were two seats from Auckland to Los Angeles on the “plus one week” date (making it four weeks off work). I booked it and asked forgiveness from the boss.
What I didn’t know is that with miles, they book you door to door. So a little work with Alaska and they’d added flights from Portland to San Francisco, Sydney to Auckland (a little over half way through the trip) and Los Angeles to Portland. For no extra miles. And because we’d lived in San Francisco, we booked an early Saturday flight to spend the day with friends (our Sydney flight departed near midnight). Lucky we did! On the day we left Portland, snow was falling and the airport closed for several days just a couple hours after we left. They ran out of de-icer.
14. New Zealand. 2009. This might be my favorite country. The Routeburn track is an all-time highlight. Auckland is great.
15. Mexico. 2009. It took a long time to get to our nearest neighbor to the South. This was the year we did Christmas with Leena’s family. Since everyone agreed that Chicago was too cold in December, we all flew to San Diego and drove down to Ensenada for the week. I’ve since been back twice: to Mexico City and Huatulco in 2015 and through Mexico City en route to Cuba in 2016. We caught the Adele concert in Mexico City in 2016 which was, as expected, fantastic.
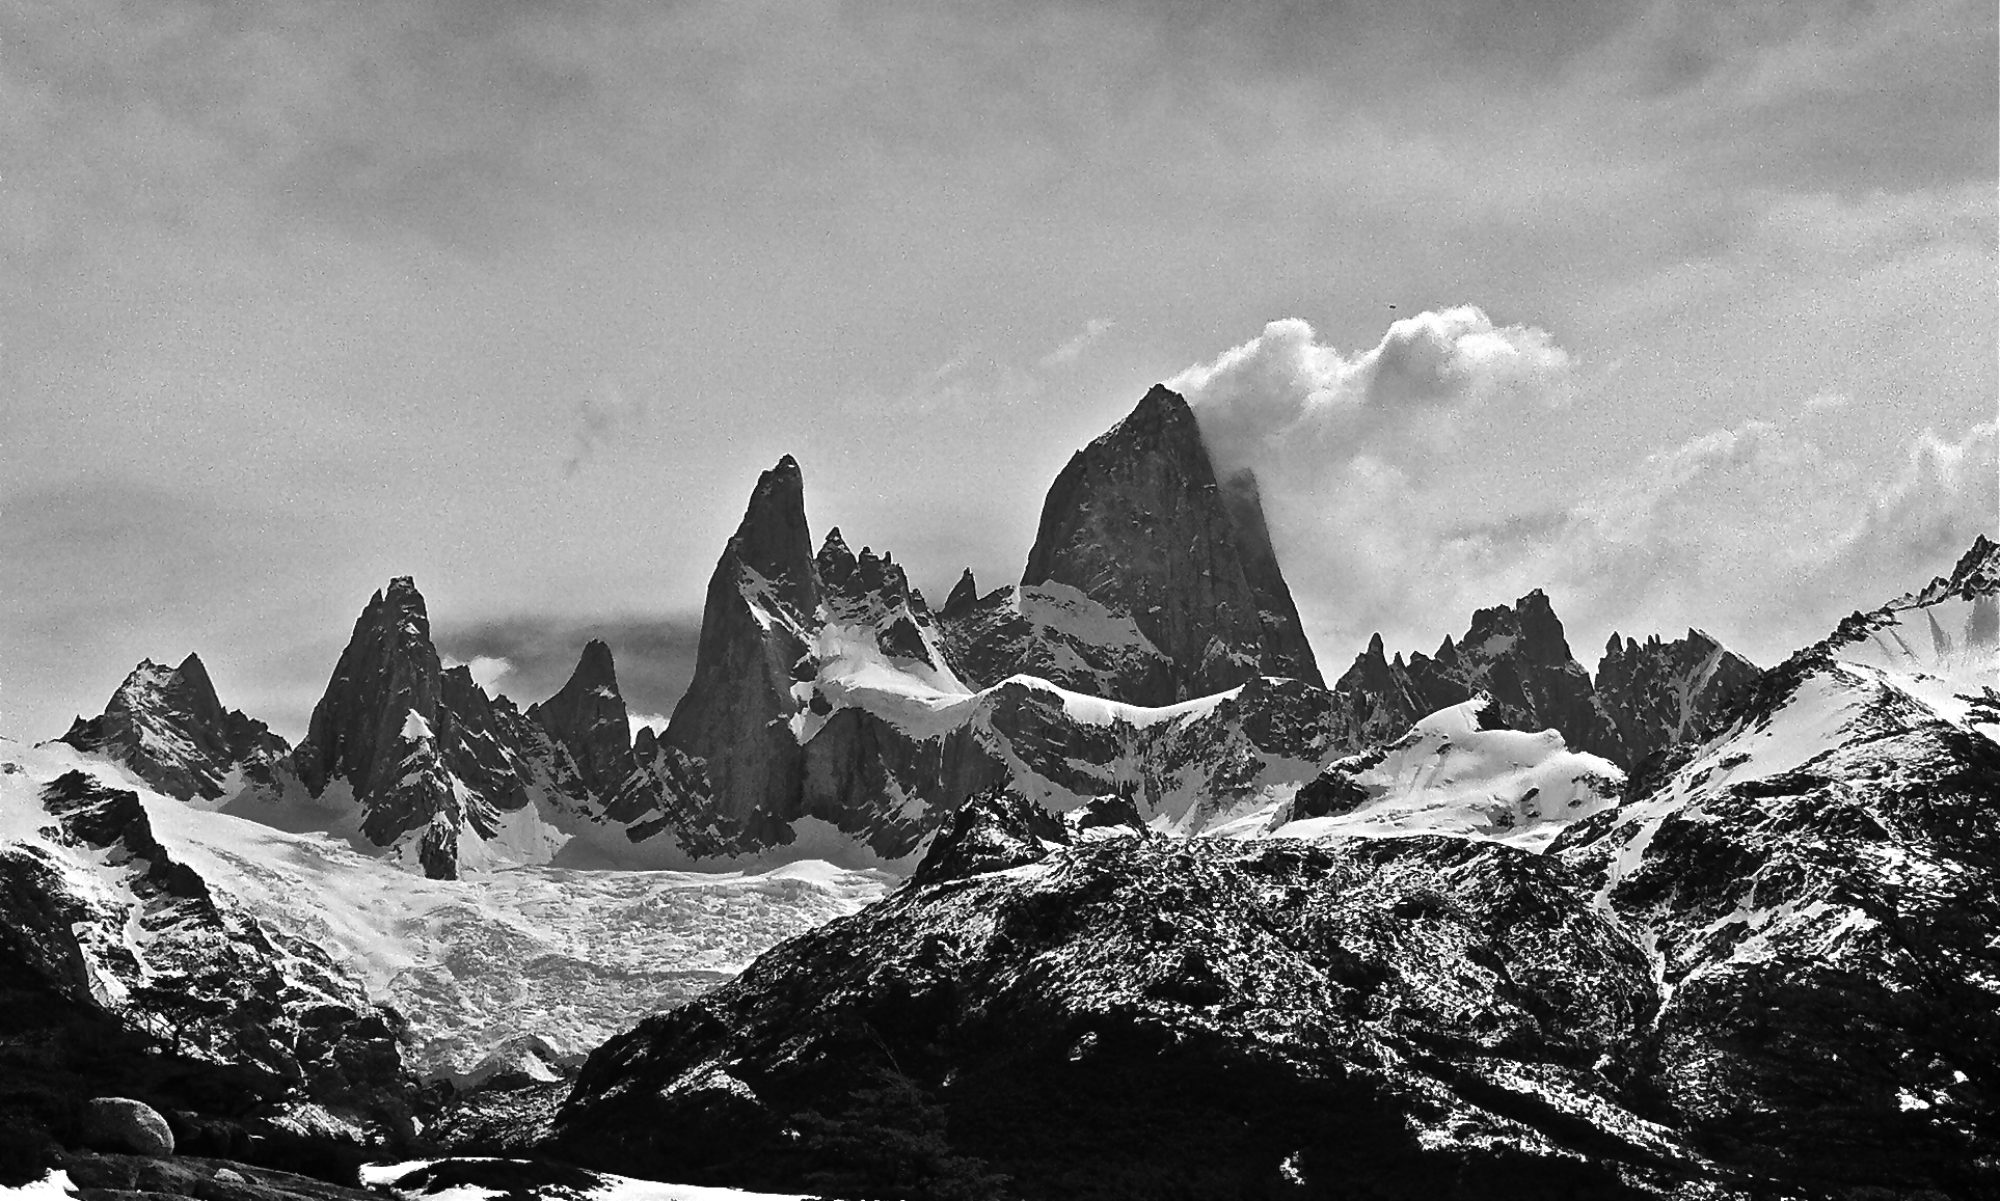
16. Argentina. 2010. A great trip to such a large and diverse country. We got our urban fix in Buenos Aires, wine country in Mendoza, the tropics at Iguazu Falls, and snow-covered hikes in Patagonia.
17. Chile. 2010. On the Argentina trip, we jumped over to Santiago for a weekend. Great city.
18. Kenya. 2013. The start of our Africa trip with two amazing safari camps.
19. Zimbabwe. 2013. Victoria Falls and rafting the Zambezi.
20. Botswana. 2013. Two more safari camps.
21. South Africa. 2013. Beautiful Cape Town and Johannesburg.
22. Panama. 2014. We did the tourist triangle: Panama City (and the canal), Boquete (mountain town) and Bocas (beach town).
23. Cuba. 2016. I’m not sure why I didn’t blog anything about this! We visited Havana and Viñales.
24. France. 2017. Our current trip. We just left today after visiting Paris and Bourdeaux. We drove to northern Spain.
25. Indonesia. 2017. After a week in Sydney, we headed to Bali for ~7 weeks early in our Big Trip.
26. Singapore. 2018. We did a quick weekend in Singapore to reset our Indonesia visas (valid for 30 days).
27. Fiji. 2018. We stopped in Fiji for a week in March on the way from New Zealand back to the US.
28. Guatemala. 2018. After a couple of weeks on the Yucatán peninsula we headed a bit further south.
29. Belize. 2018. We were two of three passengers on a small plane ride from Guatemala City to Belize City. We then hopped a ferry to Caye Caulker and spent a week on an island without cars with the motto “go slow.”
30. Portugal. 2018. After a one-day layover in London, we caught a flight down to Porto to start a couple of months in the Southwest of Europe and Northern Africa.
31. Morocco. 2018. We jumped over from Spain and explored Marrakech and Fez along with some day trips to other cities and towns.
32. Columbia. 2019. We spent a month (February into March) exploring.


